K
Understanding the URL Dashboard
Learn how to monitor and manage all your scanned pages from the URL Dashboard.
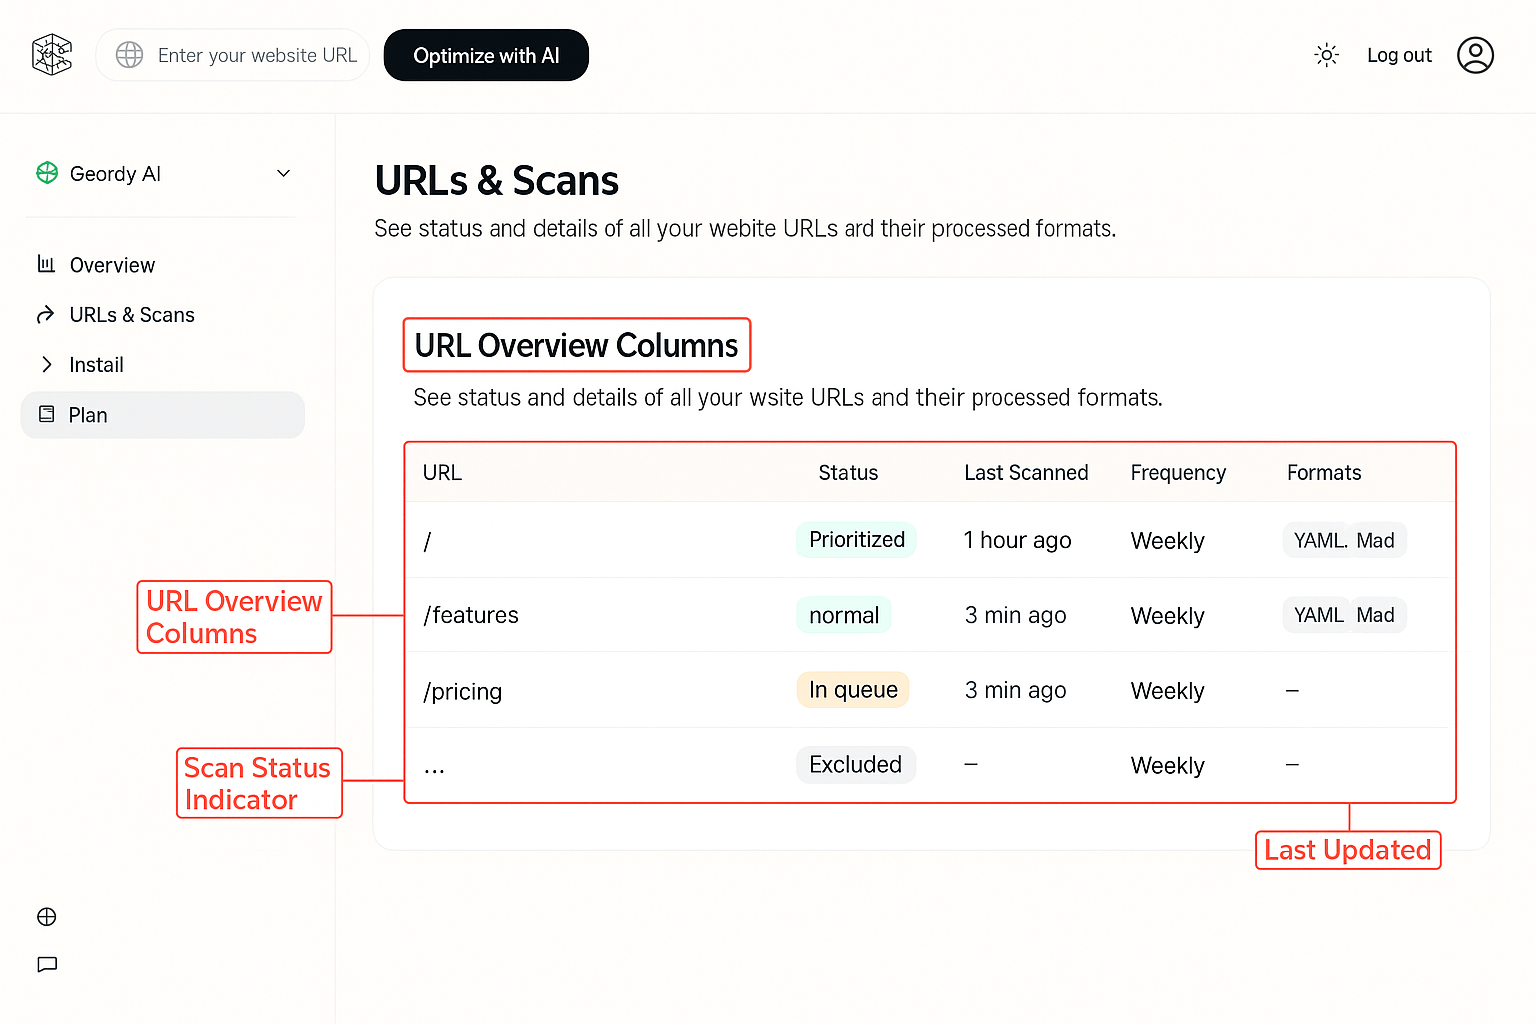
The URL Dashboard lists every scanned page, its current status, last update time, and active formats. It's the primary view for monitoring site-wide progress.
Columns Explained
| Column | Description |
|---|---|
| URL | The page address scanned by Geordy |
| Status | Indicates whether a URL is prioritized, in queue, completed, or excluded |
| Last Scanned | Timestamp of the most recent successful generation |
| Frequency (Cadence) | Refresh schedule (daily, weekly, or monthly) |
| Formats | Number of formats generated for that page |
| Actions | Options to rescan or exclude |
Status Color Codes
Statuses appear as color-coded tags throughout the dashboard:
SuccessPrioritized
PendingIn Queue
InactiveExcluded
To modify a page's status or cadence, hover over the row and select the relevant action.
Pro Tip
Use the search and filter options at the top of the dashboard to quickly find specific URLs or filter by status and cadence.